One of the craziest statistics out there is this one:
Congress has an 81% disapproval rating, but a 91% reelection rate
Clearly, the voting public is insane! It is complicated, but guess what? These people are pros when it comes to getting elected, it is what they do. I wanted to share a few simple score cards for how these high-profile elected officials are performing. I hope we can learn to pay attention to the actions of people and not so much what they say, and surely not how of feel. Actions are what matter the most, and score cards such as these are good measures of those actions.
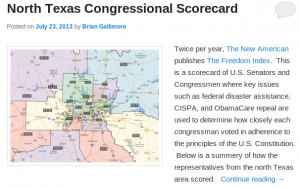
The New American publishes The Freedom Index two times per year. This is a scorecard of U.S. Senators and Congressmen where key issues are used to determine how closely each congressman voted in adherence to the principles of the U.S. Constitution. Click the graphic to see the summary of how the group from the north Texas area scored.
Empower Texans keeps track of Texas legislators in terms of fiscal responsibility performance in their Fiscal Responsibility Index.
  The index is “a measurement of how lawmakers perform on size and role of government issues. Click the graphics to see how Texas Representatives in the north Texas area did.


